
Abstract
This study sought to determine the workplace bullying, job satisfaction, job performance and their effects on teachers. This quantitative study aims to highlight the issue of bullying which badly affects teachers. The sample was comprised of all schools in Lahore. A stratified random sampling strategy was used. Four hundred teachers were selected from all schools in Lahore. The questionnaire consisted of 115 items. It was designed at a Likert. Data was analyzed through SPSS. The findings show a strong relationship between workplace bullying and job satisfaction and job performance. The findings highlight that demographic variables vary among teachers. The finding of this study that workplace bullying is increasing speedily, that suggests that organizational bullying might make teachers feel uncomfortable in their jobs, causing stress. These findings may be utilized to design successful solutions for not just preventing and managing bullying; but also for making schools safer for teachers.
Key Words
Bullying, Workplace Bullying, Teachers Behaviors, Job Satisfaction, Job Performance, School Level
Introduction
Workplace bullying (WPB) is a current issue in society that has a detrimental influence on personnel, management, the standard of work, and effectiveness in the workplace (Carbo, 2008). It is interpret as "harassing, offending, socially excluding, or negatively influencing someone's job activities" in occupational epidemiology and must take place repeatedly and regularly (for example, once per week) over an extended length of time in order to qualify (Einarsen, Hoel, & Cooper, 2003). Bullying is an aggressive and undesired conduct used to compel people to accomplish something (Kemp, 2014 and Oade, (2009). According to Townend (2016), It is one of the most sensitive forms of workplace bullying and has a severe influence on the functioning of an organization. According to Akar (2013), there has been an increase in interest in organizational psychology and it has become a widespread problem in organizations. Employee attitudes toward workplace bullying were investigated by Rooyen and McCormack (2013), who discovered that if workplace bullying is not well managed. Ikanyon and Ucho (2013) found that employees who deal with less bullying perform better than those who suffer more bullying. Organizations need to foster a culture that encourages creativity and risk-taking to succeed in a competitive world (Hamel, 2000). Bullying victims are not the only ones who suffer, as bystanders of bullying can also experience similar effects (Oladapo, 2013). Several studies have found that workplace bullying has negative consequences for businesses, including worse job performance, excessive absenteeism, diminished organizational commitment. According to the vast majority of studies on workplace bullying, there is a direct link between bullying and bad results for both people and the organization. Losses in production have an effect on the company. Bullying at work has a bad impact on employees' intention to quit, job performance, and job satisfaction. (Amy C. Francis, 2014).
According to Marshall, 2007, Professional isolation is a term used to describe inadequate social and professional interaction at work. Academic research has shown that telecommuting employees may experience social or professional isolation at work. There is mounting scientific proof that a number of organizational factors can affect isolation at work, such as higher level of organizational responsiveness, perceived organizational support, and perceived social support (Cooper & Kurland, 2002). Bostanci (2013) revealed that higher level of organizational responsiveness minimizes workplace isolation. Perceived organizational support, according to Riggle et al. (2015), lessens social isolation at work. In addition, Bentley et al. (2016) discovered that workplace isolation decreases when perceived support is high. Gallatin (2018) found that colleague assistance can lessen teleworkers' perceptions of job isolation. Bullying can also have negative consequences for teachers' professional lives, as it can lead to diminished commitment to their jobs and the organization (Hoel & Cooper, 2000). Increased levels of dread and anxiety, poorer self-esteem, lower self-efficacy, and reduced conviction in professional competence all contribute to a decline in work satisfaction for the target (Bernstein & Trimm, 2016). A typical bullying method is to publicly humiliate educators in front of others (cf. Blasé & Blasé, 2004). It is demoralizing and may have long-term implications on educators when they are publicly ridiculed in front of their students and colleagues. These impacts include shame, a loss of respect from their students as well as depression, stress, and burnout (cf. De Wet, 2010a). A typical bullying method is to publicly humiliate educators in front of others (cf. Blasé & Blasé, 2004).
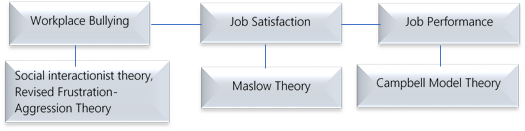
Job satisfaction is one of the most important factors used to evaluate how employees feel about their work and has a big impact on how organizations and individual workers flourish (Bono, & Patton, 2001). In the 1940s and 1950s, A.H. Maslow created the hierarchy of needs model, which helps organizations motivate their staff from the standpoint that motivated staff are expected to be more satisfied (Luthans, 1995). Job performance is defined by the online dictionary of Wikipedia as "the quality and quantity anticipated in a given job from an employee to execute their task properly," and various variables, including workplace bullying, can affect employee performance. According to Rooyen & McCormack (2013), to achieve organizational goals, greater effort is needed to raise staff performance.
Conflict in the workplace is expensive for all firms, and hidden costs can have a negative effect on decision-making. Leaders who can convince, motivate, and guide people will often be rewarded by their colleagues' loyalty and performance (Mosadegh & Yarmohammadian 2006). HR practices have a positive correlation between employee performance and organizational productivity (Tessema and Soeters, 2006), and compensation should reflect the organization's culture and strategic plans. Employees who are more productive are paid more than they would otherwise be, according to the pay structure. According to Armstrong (2005), compensation encompasses policies and strategies that try to consistently pay workers fairly.
In the past research, some demographic variables that can relate to the workplace bullying, job satisfaction and job performance. Most of teachers were become victim of bullying on the basis of demographic variables. Some become a victim of bullying on the basis of gender, some on age, some on race, some on ethnicity, some on Experience, some on class level they teach, some on class size, administrative position and type of institute whether it is public or private. These all factors have minimum or maximum effect on victim.
Purpose of the Study
Past researches normally done at the Workplace Bullying. Researchers have developed questionnaire to measure the Workplace Bullying. Much of the discussion on bullying in schools, Workplace Bullying has focused. Past researches is on Workplace Bullying and Job Satisfaction or Workplace Bullying and Job Performance. But here researcher dig into the effect of Workplace Bullying on Job satisfaction and Job Performance at school Level.
Systematic research has not been conducted to examine the effect of Workplace Bullying on Job Satisfaction and Job Performance. Workplace bullying focused on Behavior that causes Isolation, Behavior that undermining the professional status, Behavior that undermining the victim as a person, Direct Negative Behavior. This current study focused on Workplace Bullying, Job Satisfaction and Job Performance. Job satisfaction and good Job performance is very necessary for teachers, so that they can teach their students well.
This study will helpful for the Principals, Teachers, Students and researchers. It will measure workplace bullying existence towards teachers, how it works and its effects on teacher’s job satisfaction and Job Performance.
Statement of the Problem
Bullying directed towards teachers is a two-fold obstacle. The issue of the workplace is apparently getting more awareness in the society. This current study focused on looking at the effect on teachers’ job satisfaction and job performance among teachers who are the victim of Workplace Bullying. Therefore, the statement of the problem was designed as an “effect of workplace bullying on job satisfaction and job performance at school level.”
Objectives of the Study
The objectives of the study are:
1. To ascertain the perceived level of Workplace Bullying.
2. To determine the perceived level of Job Satisfaction.
3. To ascertain the perceived level of Job Performance.
4. To recognize the relationship between Workplace Bullying and Job Satisfaction.
5. To point out the relationship between Workplace Bullying and Job Performance.
6. To identify the relationship between Job Satisfaction and Job Performance.
7. To examine the role of demographic variables in Workplace bullying, Job Satisfaction and Job Performance.
Research Questions
The following research questions were designed:
1.1 What is the perceived level of Workplace
Bullying?
1.1.1 What are the behaviors that cause Isolation among teachers?
1.1.2 What are the behaviors that undermine the professional status of teachers?
1.1.3 What are the behaviors that undermine the victim as a person?
1.1.4 What are the behaviors that undermine the victim as a person?
2.1 How is the Job Satisfaction of teachers affected by Workplace Bullying?
3.1 How is the Job Performance of teachers affected by Workplace Bullying?
4.1 Do the Job satisfaction plays a mediating role between Workplace Bullying?
5.1 Is there any link between Workplace Bullying, Job Performance?
6.1 Is there any relationship between Job Satisfaction and Job performance?
7.1 Is there any role of Demographic variables in Workplace bullying, job satisfaction and Job performance?
Operational Definitions
Workplace Bullying
All those consistent behaviors aimed towards one or more workers that the victim does not desire, that may be done deliberately or instinctively, that obviously humiliate, offend, or upset the victim, and that may impede work performance or foster a toxic work environment (Einarsen, 1999).
Job Satisfaction
“A positive or pleasant emotional state resulting from a person’s appreciation of his/her own job experience” (Demirtas, 2010). According to Locke (1976) “the pleasurable emotional state resulting from the appraisal of one’s job as achieving or facilitating one’s job values”.
Job Performance
An individual's cumulative expected value to the organisation over a specified period of time is known as their job performance. (Motowidlo, Borman, and Schmit, 1997).
Conceptual Framework
Figure 1
 With the help of a conceptual framework, researcher was able to conduct systematically research. It shows the relationship and effect of variables by the response of teachers at the school level. The study contained three variables: Workplace Bullying, Job Satisfaction and Job Performance. In this research, the researcher analyzed Workplace Bullying by its 4 indicators, Job satisfaction and Job performance by 4 indicators which are mentioned above. While assessing the Workplace bullying, the focus is on the behavior of teachers when they become a victim of Bullying. In job Satisfaction, the researcher emphasized that when teachers become perpetrators of bullying, their job satisfaction totally affected. In Job performance, the researcher highlighted with the help of factors that the job performance of teachers also hit. After that researcher examined these by demographic variables which were Gender, Qualification, Age, Administrative responsibility, Class level they teach, Institute Type and Teaching Experience.
Theoretical Framework
Figure 2

Population and Target Population
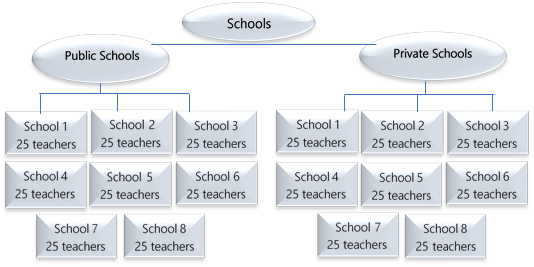
The total population was teachers of 8th, 9th and 10th level classes who enrolled in the public and private schools in Lahore city. The total population is approximately 31,392 schools in Lahore city (Pakistan Education Statistics 2017- 2018). There were 1.8 million qualified teachers employed in the academic year (2017–18). The target population was 16 schools in Lahore selected for research. There were 8 public and 8 private schools.
Table 1
| Total Number of Schools width="90" valign="top">31,392 | > Total Number of Teachers width="90" valign="top">1.8 million |
Figure 3

Instrument
The questionnaire consisted of 4 parts 1st was on Demographic, 2nd on Workplace Bullying which >was adapted from (DE WET AND L JACOBS and> Lynette Jacobs). 3rd on Job Satisfaction and 4th on Job Performance. Both questionnaires developed by the researcher with the help of a literature review. Questions were close- ended. There were total 115 items in the instrument. Likert scale was used in the questionnaire.>Data was collected from public and private schools in Lahore. The questionnaire consisted of 6 factors. The independent variable is Workplace >Bullying which consisted of 4 factors; 1) Behavior that causes Isolation consisted of 17 statements, 2) Behavior that undermines the professional status included 23 statements, 3) Behavior that undermines the victim as a person included 14 statements. 3) Direct Negative Behavior included 6 statements that present the negative behavior of teachers. 4) Teachers’ Job Satisfaction to analyze the teachers’ job satisfaction according to their job when they are a victim of Workplace bullying, this include 38 statements. 5) The last one was Job Performance which consisted of 4 indicators, 1) Work-life Conflicts included 5 statements, 2) Leadership contained 5 statements, 3) Working Conditions consisted on 4 statements and 4) Compensation included 3 statements. It analyzes the job performance of teachers that affect because of workplace bullying. Whole questionnaire had 115 statements that were answered by teachers (participants). Teachers had to tick on the right option according to them. It was made possible that all the statements in the questionnaire were understandable and the respondents were not confused.>
>The instrument was piloted by distributing 100 questionnaires from teachers of public and private schools in Lahore. Data was collected in almost 10-15 days. The answers were analyzed in SPSS version 21. The reliability of the questionnaire was (.850), so this questionnaire was found reliable.
>Table 2 align="center">
| Variable width="136">Alpha width="116">No. of Items | > Workplace Bullying width="136">.789 width="116">60 | > Behavior that causes isolation width="136">.829 width="116">17 | > Behavior that undermining the professional status width="136">.836 width="116">23 | > Behavior that undermining the victim as a person width="136">.834 width="116">14 | > Direct negative behavior width="136">.850 width="116">6 | > Job Satisfaction width="136">.810 width="116">38 | > Job Performance width="136">.830 width="116">17 | > Work-life conflicts width="136">.849 width="116">5 | > Leadership width="136">.848 width="116">5 | > Working conditions width="136">.849 width="116">4 | > Compensation width="136">.853 width="116">3 | > Total questionnaire width="136">.850 width="116">115 |
Validity and Reliability of Instrument
>The validity of the instrument was at a significant level of 0.01. The reliability of the questionnaire was .862. > >Table 3 align="center">| Variable width="78">Person Correlation width="60">Sig.2 width="66">Alpha width="84">No. of Items width="90">No. of Respondents | > Workplace Bullying width="78">.992 width="60">.001 width="66">.809 width="84">60 width="90">400 | > Behavior that causes isolation width="78">.991 width="60">.001 width="66">.844 width="84">17 width="90">400 | > Behavior that undermining the professional status width="78">.975 width="60">.001 width="66">.850 width="84">23 width="90">400 | > Behavior that undermining the victim as a person width="78">.991 width="60">.001 width="66">.833 width="84">14 width="90">400 | > Direct negative behavior width="78">.886 width="60">.001 width="66">.863 width="84">6 width="90">400 | > Job Satisfaction width="78">.978 width="60">.001 width="66">.827 width="84">38 width="90">400 | > Job Performance width="78">.967 width="60">.001 width="66">.846 width="84">17 width="90">400 | > Work-life conflicts width="78">.975 width="60">.001 width="66">.862 width="84">5 width="90">400 | > Leadership width="78">.959 width="60">.001 width="66">.861 width="84">5 width="90">400 | > Working conditions width="78">.856 width="60">.001 width="66">.863 width="84">4 width="90">400 | > Compensation width="78">.792 width="60">.001 width="66">.866 width="84">3 width="90">400 | > Total questionnaire width="78">.874 width="60">.001 width="66">.862 width="84">115 width="90">400 |
Variable
width="90">Mean
width="84">St.D
width="73">MPI
Workplace Bullying
width="90">118.7950
width="84">38.73265
width="73">1.97
Behavior that causes isolation
width="90">34.0600
width="84">11.14572
width="73">2.00
Behavior that undermining the professional status
width="90">46.0975
width="84">15.89464
width="73">2.00
Behavior that undermining the victim as a person
width="90">27.0625
width="84">9.07659
width="73">1.93
Direct negative behavior
width="90">11.5750
width="84">3.09002
width="73">1.91
Variable
width="134">Mean
width="134">St.D
width="134">MPI
Job Satisfaction
width="134">75.6750
width="134">20.85285
width="134">1.99
| Variable width="126">Mean width="128">St.D width="138">MPI | > Job Performance width="126">33.0175 width="128">10.62424 width="138">2.00 | > Work-life conflicts width="126">10.0075 width="128">2.87718 width="138">2.00 | > Leadership width="126">9.9975 width="128">3.50116 width="138">1.99 | > Working conditions width="126">7.9850 width="128">3.09657 width="138">1.99 | > Compensation width="126">5.0275 width="128">1.84940 width="138">1.67 |
Variable
width="114">Mean
width="132">St.D
width="72">p-value
width="78">Sig.2
Workplace Bullying
width="114">118.7950
width="132">38.73265
width="72" rowspan="2">.949
width="78" rowspan="2">.001
Job Satisfaction
width="114">75.6750
width="132">20.85285
Variable
width="114">Mean
width="112">SD
width="80">p-value
width="84">Sig.
Workplace Bullying
width="114">118.7950
width="112">38.73265
width="80" rowspan="2">.946
width="84" rowspan="2">.002
Job Performance
width="114">33.0175
width="112">10.62424
| Variable width="102">Mean width="120">SD width="102">p-value width="103">Sig. | > Job Satisfaction width="102">75.6750 width="120">20.85285 width="102" rowspan="2">.939 width="103" rowspan="2">.002 | > Job Performance width="102">33.0175 width="120">10.62424 |
Role of Demographic variable in Workplace bullying, Job satisfaction and Job Performance to analyze the demographic Variables, the researcher used Gender Category.
Respondents as Gender according to Workplace Bullying
| width="59"> Variable width="50">N width="66">Mean width="66">SD width="54">t-value width="42">df width="44">Sig | > Workplace Bullying width="59">Female width="50">266 width="66">119.8008 width="66">39.16354 width="54" rowspan="2">.731 width="42" rowspan="2">400 width="44" rowspan="2">.001 | > Male width="50">134 width="66">116.7985 width="66">37.92866 | > Behavior that causes isolation width="59">Female width="50">266 width="66">34.2331 width="66">11.21380 width="54" rowspan="2">.437 width="42" rowspan="2">400 width="44" rowspan="2">.002 | > Male width="50">134 width="66">33.7164 width="66">11.04305 | > Behavior that undermining professional status width="59">Female width="50">266 width="66">24.2105 width="66">8.49022 width="54" rowspan="2">.444 width="42" rowspan="2">400 width="44" rowspan="2">.000 | > Male width="50">134 width="66">23.8134 width="66">8.37484 | > Behavior that undermining the victim as a person width="59">Female width="50">266 width="66">49.8534 width="66">16.76669 width="54" rowspan="2">1.312 width="42" rowspan="2">400 width="44" rowspan="2">.000 | > Male width="50">134 width="66">47.5522 width="66">16.14715 | > Direct negative behavior width="59">Female width="50">266 width="66">11.5038 width="66">3.15421 width="54" rowspan="2">-.649 width="42" rowspan="2">400 width="44" rowspan="2">.001 | > Male width="50">134 width="66">11.7164 width="66">2.96499 |
An independent – samples t-test was conducted to compare Gender type scores at .001
Table 11.
Respondents as Gender according to Job Satisfaction
| Variable width="86">N width="87">Mean width="91">St.D width="86">t-value width="86">Sig | > Female width="86">266 width="87">75.9586 width="91">21.02241 width="86" rowspan="2">.383 width="86" rowspan="2">.001 | > Male width="86">134 width="87">75.1119 width="91">20.57872 |
An independent – samples t-test was conducted to compare Gender type scores at .001 regarding the Job Satisfaction.
Table 12.
Respondents as Gender according to Job Performance
| width="78"> Variable width="50">N width="77">Mean width="79">SD width="58">t-value width="41">df width="44">Sig | > Job performance width="78">Female width="50">266 width="77">33.7105 width="79">10.83682 width="58" rowspan="2">1.884 width="41" rowspan="2">400 width="44" rowspan="2">.001 | > Male width="50">134 width="77">31.6418 width="79">10.08789 | > Work-life conflicts width="78">Female width="50">266 width="77">10.0602 width="79">2.89504 width="58" rowspan="2">.515 width="41" rowspan="2">400 width="44" rowspan="2">.000 | > Male width="50">134 width="77">9.9030 width="79">2.84927 | > Leadership width="78">Female width="50">266 width="77">10.0526 width="79">3.57099 width="58" rowspan="2">.443 width="41" rowspan="2">400 width="44" rowspan="2">.000 | > Male width="50">134 width="77">9.8881 width="79">3.36872 | > Working conditions width="78">Female width="50">266 width="77">8.0338 width="79">3.17341 width="58" rowspan="2">.444 width="41" rowspan="2">400 width="44" rowspan="2">.001 | > Male width="50">134 width="77">7.8881 width="79">2.94731 | > Compensation width="78">Female width="50">266 width="77">5.5639 width="79">1.83818 width="58" rowspan="2">8.946 width="41" rowspan="2">400 width="44" rowspan="2">.000 | > Male width="50">134 width="77">3 .9627 width="79">1.34560 |
An independent – samples t-test was conducted to compare Gender type scores for at .001
To Analyze the Age
Respondents as Age according to Workplace Bullying
| width="72"> Variable width="35">N width="78">Mean width="96">St.D width="60">df width="54">F width="37">Sig | > Workplace Bullying width="72">25 to 30 width="35">88 width="78">118.3977 width="96">40.04783 width="60" rowspan="4">3 align="center">396 width="54" rowspan="4">.611 width="37" rowspan="4">.608 | > 31 to 35 width="35">148 width="78">116.0135 width="96">38.52007 | > 36 to 40 width="35">75 width="78">119.8533 width="96">36.24902 | > 40 Above width="35">89 width="78">122.9213 width="96">40.02023 | > Behavior that causes isolation width="72">25 to 30 width="35">88 width="78">33.9205 width="96">11.48835 width="60" rowspan="4">3 align="center">396 width="54" rowspan="4">.736 width="37" rowspan="4">.531 | > 31 to 35 width="35">148 width="78">33.2297 width="96">11.15817 | > 36 to 40 width="35">75 width="78">34.2267 width="96">10.68033 | > 40 Above width="35">89 width="78">35.4382 width="96">11.21379 | > Behavior that undermining professional status width="72">25 to 30 width="35">88 width="78">24.0568 width="96">8.67068 width="60" rowspan="4">3 align="center">396 width="54" rowspan="4">.574 width="37" rowspan="4">.632 | > 31 to 35 width="35">148 width="78">23.4595 width="96">8.43251 | > 36 to 40 width="35">75 width="78">24.3333 width="96">8.09460 | > 40 Above width="35">89 width="78">24.9101 width="96">8.58069 | > Behavior that undermining victim as a person width="72">25 to 30 width="35">88 width="78">48.7614 width="96">17.33178 width="60" rowspan="4">3 align="center">396 width="54" rowspan="4">.595 width="37" rowspan="4">.618 | > 31 to 35 width="35">148 width="78">47.9459 width="96">16.32859 | > 36 to 40 width="35">75 width="78">49.6400 width="96">15.27729 | > 40 Above width="35">89 width="78">50.8202 width="96">17.37132 | > Direct negative behavior width="72">25 to 30 width="35">88 width="78">11.6591 width="96">2.98997 width="60" rowspan="4">3 align="center">396 width="54" rowspan="4">.334 width="37" rowspan="4">.801 | > 31 to 35 width="35">148 width="78">11.3784 width="96">3.22069 | > 36 to 40 width="35">75 width="78">11.6533 width="96">2.61747 | > 40 Above width="35">89 width="78">11.7528 width="96">3.35505 |
A one way between groups analysis of variance was conducted to explore the impact of age at .608 regarding Workplace Bullying.
Table 14.
Respondents as Age according to Job Satisfaction
| Variable width="58">N width="86">Mean width="93">SD width="83">Df width="64">F width="62">Sig | > 25 to 30 width="58">88 width="86">74.7841 width="93">21.16300 width="83" rowspan="4">3 align="center"> align="center"> align="center">397 width="64" rowspan="4">align="center">1.192 width="62" rowspan="4">align="center">.312 | > 31 to 35 width="58">148 width="86">74.4527 width="93">21.21812 | > 36 to 40 width="58">75 width="86">74.7733 width="93">19.43706 | > 40 Above width="58">89 width="86">79.3483 width="93">21.01033 |
An independent – samples t-test was conducted to compare age type at .312 regarding Job satisfaction.
Table 15.
Respondents as Age according to Job Performance
| width="82"> Variable width="56">N width="82">Mean width="82">St.D width="46">df width="42">F width="42">Sig | > Job Performance width="82">25 to 30 width="56">88 width="82">32.5114 width="82">11.22087 width="46" rowspan="4">3 align="center">396 width="42" rowspan="4">.635 width="42" rowspan="4">.593 | > 31 to 35 width="56">148 width="82">32.4595 width="82">10.32096 | > 36 to 40 width="56">75 width="82">33.2000 width="82">9.47828 | > 40 Above width="56">89 width="82">34.2921 width="82">11.46160 | > Work-life conflicts width="82">25 to 30 width="56">88 width="82">9.8636 width="82">2.96020 width="46" rowspan="4">3 align="center">396 width="42" rowspan="4">1.25 width="42" rowspan="4">.288 | > 31 to 35 width="56">148 width="82">9.8378 width="82">2.89511 | > 36 to 40 width="56">75 width="82">9.8933 width="82">2.69420 | > 40 Above width="56">89 width="82">10.5281 width="82">2.90020 | > Leadership width="82">25 to 30 width="56">88 width="82">9.9091 width="82">3.70968 width="46" rowspan="4">3 align="center">396 width="42" rowspan="4">.366 width="42" rowspan="4">.778 | > 31 to 35 width="56">148 width="82">9.8108 width="82">3.37730 | > 36 to 40 width="56">75 width="82">10.2000 width="82">3.14084 | > 40 Above width="56">89 width="82">10.2247 width="82">3.80416 | > Working conditions width="82">25 to 30 width="56">88 width="82">7.8523 width="82">3.25732 width="46" rowspan="4">3 align="center">396 width="42" rowspan="4">.239 width="42" rowspan="4">.869 | > 31 to 35 width="56">148 width="82">7.8986 width="82">2.95255 | > 36 to 40 width="56">75 width="82">8.2000 width="82">2.72625 | > 40 Above width="56">89 width="82">8.0787 width="82">3.47793 | > Compensation width="82">25 to 30 width="56">88 width="82">4.8864 width="82">1.85343 width="46" rowspan="4">3 align="center">396 width="42" rowspan="4">2.115 width="42" rowspan="4">.098 | > 31 to 35 width="56">148 width="82">4.9122 width="82">1.83292 | > 36 to 40 width="56">75 width="82">4.9067 width="82">1.53494 | > 40 Above width="56">89 width="82">5.4607 width="82">2.06737 |
A one way between groups analysis of variance was conducted to explore the impact of age at .593.
Qualification of the Respondents
Respondents as Qualification according to Workplace Bullying
| width="66" valign="top"> Variable width="48" valign="top">N width="60" valign="top">Mean width="66" valign="top">SD width="54" valign="top">t-value width="42" valign="top">df width="41" valign="top">Sig. | > Workplace Bullying width="66" valign="top">Masters width="48" valign="top">182 width="60" valign="top">116.9615 width="66" valign="top">40.44236 width="54" rowspan="2" valign="top">-.651 width="42" rowspan="2" valign="top">400 width="41" rowspan="2" valign="top">.515 | > MPhil width="48" valign="top">135 width="60" valign="top">119.814 width="66" valign="top">35.88626 | > Behavior that causes isolation width="66" valign="top">Masters width="48" valign="top">182 width="60" valign="top">33.5604 width="66" valign="top">11.56458 width="54" rowspan="2" valign="top">-.634 width="42" rowspan="2" valign="top">400 width="41" rowspan="2" valign="top">.526 | > MPhil width="48" valign="top">135 width="60" valign="top">34.3556 width="66" valign="top">10.27928 | > Behavior that undermining the professional status width="66" valign="top">Masters width="48" valign="top">182 width="60" valign="top">23.7747 width="66" valign="top">8.84669 width="54" rowspan="2" valign="top">-.477 width="42" rowspan="2" valign="top">400 width="41" rowspan="2" valign="top">.633 | > MPhil width="48" valign="top">135 width="60" valign="top">24.2296 width="66" valign="top">7.72951 | > Behavior that undermining victim as a person width="66" valign="top">Masters width="48" valign="top">182 width="60" valign="top">48.2747 width="66" valign="top">17.34063 width="54" rowspan="2" valign="top">-.665 width="42" rowspan="2" valign="top">400 width="41" rowspan="2" valign="top">.506 | > MPhil width="48" valign="top">135 width="60" valign="top">49.5259 width="66" valign="top">15.42765 | > Direct negative behavior width="66" valign="top">Masters width="48" valign="top">182 width="60" valign="top">11.3516 width="66" valign="top">3.13023 width="54" rowspan="2" valign="top">-1.005 width="42" rowspan="2" valign="top">400 width="41" rowspan="2" valign="top">.315 | > MPhil width="48" valign="top">135 width="60" valign="top">11.7037 width="66" valign="top">3.01755 |
An independent – samples t-test was conducted to compare Qualification type scores for MPhil and Master at .515
Table 17.
Respondents as Qualification according to Job Satisfaction
| Variable width="73" valign="top">N width="84" valign="top">Mean width="90" valign="top">Std.D width="73" valign="top">df width="75" valign="top">F width="61" valign="top">Sig | > Masters width="73" valign="top">182 width="84" valign="top">74.2967 width="90" valign="top">20.91683 width="73" rowspan="2" valign="top">2>397 width="75" rowspan="2" valign="top">-1.045 width="61" rowspan="2" valign="top">.315 | > Mphil width="73" valign="top">135 width="84" valign="top">76.7259 width="90" valign="top">19.86162 |
An independent – samples t-test was conducted to compare Qualification type scores for Master and M.Phil at .315 regarding the Job Satisfaction.
Respondents as Qualification according to Job Performance
| width="74"> Variable width="56">N width="69">Mean width="72">SD width="64">t-value width="43">df width="60">Sig. | > Job Performance width="74">Masters width="56">182 width="69">32.3407 width="72">10.91729 width="64" rowspan="2">-.930 width="43" rowspan="2">400 width="60" rowspan="2">.353 | > MPhil width="56">135 width="69">33.4593 width="72">10.13695 | > Work-life conflicts width="74">Masters width="56">182 width="69">9.8187 width="72">2.88549 width="64" rowspan="2">-1.050 width="43" rowspan="2">400 width="60" rowspan="2">.294 | > MPhil width="56">135 width="69">10.1556 width="72">2.73961 | > Leadership width="74">Masters width="56">182 width="69">9.8187 width="72">3.65276 width="64" rowspan="2">-.712 width="43" rowspan="2">400 width="60" rowspan="2">.477 | > MPhil width="56">135 width="69">10.1037 width="72">3.34636 | > Working conditions width="74">Masters width="56">182 width="69">7.8242 width="72">3.17481 width="64" rowspan="2">-.721 width="43" rowspan="2">400 width="60" rowspan="2">.472 | > MPhil width="56">135 width="69">8.0815 width="72">3.10044 | > Compensation width="74">Masters width="56">182 width="69">4.8791 width="72">1.81665 width="64" rowspan="2">-1.151 width="43" rowspan="2">400 width="60" rowspan="2">.250 | > MPhil width="56">135 width="69">5.1185 width="72">1.84897 |
An independent – samples t-test was conducted to compare Qualification type scores for MPhil and Master at .353
Teaching Experience
Respondents as Experience according to Workplace Bullying
| width="128"> Variable width="42">N width="64">Mean width="66">SD width="48">df width="48">F width="42">Sig | > Workplace Bullying width="128">Less than 5 years width="42">88 width="64">118.3977 width="66">40.04783 width="48" rowspan="4">3 align="center"> align="center">397 width="48" rowspan="4">.611 width="42" rowspan="4">.000 | > 6 - 10 years width="42">148 width="64">116.0135 width="66">38.52007 | > 11 – 15 years width="42">75 width="64">119.8533 width="66">36.24902 | > More than 15 years width="42">89 width="64">122.9213 width="66">40.02023 | > Behavior that causes isolation width="128">Less than 5 years width="42">88 width="64">33.9205 width="66">11.48835 width="48" rowspan="4">3 align="center"> align="center"> width="48" rowspan="4">.736 width="42" rowspan="4">.001 | > 6 - 10 years width="42">148 width="64">33.2297 width="66">11.15817 | > 11 – 15 years width="42">75 width="64">34.2267 width="66">10.68033 | > More than 15 years width="42">89 width="64">35.4382 width="66">11.21379 | > Behavior that undermining the professional status width="128">Less than 5 years width="42">88 width="64">24.0568 width="66">8.67068 width="48" rowspan="4">3 align="center"> align="center">397 width="48" rowspan="4">.574 width="42" rowspan="4">.001 | > 6 - 10 years width="42">148 width="64">23.4595 width="66">8.43251 | > 11 – 15 years width="42">75 width="64">24.3333 width="66">8.09460 | > More than 15 years width="42">89 width="64">24.9101 width="66">8.58069 | > Behavior that undermining the victim as a person width="128">Less than 5 years width="42">88 width="64">48.7614 width="66">17.33178 width="48" rowspan="4">3 align="center"> align="center"> align="center">397 width="48" rowspan="4">.595 width="42" rowspan="4">.000 | > 6 - 10 years width="42">148 width="64">47.9459 width="66">16.32859 | > 11 – 15 years width="42">75 width="64">49.6400 width="66">15.27729 | > More than 15 years width="42">89 width="64">50.8202 width="66">17.37132 | > Direct negative behavior width="128">Less than 5 years width="42">88 width="64">11.6591 width="66">2.98997 width="48" rowspan="4">3 align="center"> align="center">397 width="48" rowspan="4">.334 width="42" rowspan="4">.000 | > 6 - 10 years width="42">148 width="64">11.3784 width="66">3.22069 | > 11 – 15 years width="42">75 width="64">11.6533 width="66">2.61747 | > More than 15 years width="42">89 width="64">11.7528 width="66">3.35505 |
A one way between groups analysis of variance was conducted to explore the impact of experience at .000 regarding Workplace Bullying.
Table 20.
Respondents as Experience according to Job Satisfaction
| Variable width="72">N width="90">Mean width="90">Std.D width="54">df width="51">F width="51">Sig. | > Less than 5 years width="72">88 width="90">74.7841 width="90">21.16300 width="54" rowspan="4">3 align="center"> align="center">397 width="51" rowspan="4">1.192 width="51" rowspan="4">.000 | > 6 - 10 years width="72">148 width="90">74.4527 width="90">21.21812 | > 11 – 15 years width="72">75 width="90">74.7733 width="90">19.43706 | > More than 15 years width="72">89 width="90">79.3483 width="90">21.01033 |
An independent – samples t-test was conducted to compare teaching at .000 regarding Job satisfaction.
Table 21.
Respondents as Experience according to Job Performance
| width="126"> Variable width="41">N width="58">Mean width="62">SD width="43">df width="42">F width="48">Sig | > Job Performance width="126">Less than 5 years width="41">88 width="58">32.5114 width="62">11.22087 width="43" rowspan="4">3 align="center"> align="center"> align="center">397 width="42" rowspan="4">.635 width="48" rowspan="4">.000 | > 6 - 10 years width="41">148 width="58">32.4595 width="62">10.32096 | > 11 – 15 years width="41">75 width="58">33.2000 width="62">9.47828 | > More than 15 years width="41">89 width="58">34.2921 width="62">11.46160 | > Work-life conflicts width="126">Less than 5 years width="41">88 width="58">9.8636 width="62">2.96020 width="43" rowspan="4">3 align="center"> align="center"> align="center">397 width="42" rowspan="4">1.258 width="48" rowspan="4">.000 | > 6 - 10 years width="41">148 width="58">9.8378 width="62">2.89511 | > 11 – 15 years width="41">75 width="58">9.8933 width="62">2.69420 | > More than 15 years width="41">89 width="58">10.5281 width="62">2.90020 | > Leadership width="126">Less than 5 years width="41">88 width="58">9.9091 width="62">3.70968 width="43" rowspan="4">3 align="center"> align="center"> align="center">397 width="42" rowspan="4">.366 width="48" rowspan="4">.000 | > 6 - 10 years width="41">148 width="58">9.8108 width="62">3.37730 | > 11 – 15 years width="41">75 width="58">10.2000 width="62">3.14084 | > More than 15 years width="41">89 width="58">10.2247 width="62">3.80416 | > Working conditions width="126">Less than 5 years width="41">88 width="58">7.8523 width="62">3.25732 width="43" rowspan="4">3 align="center"> align="center"> align="center">397 width="42" rowspan="4">.239 width="48" rowspan="4">.000 | > 6 - 10 years width="41">148 width="58">7.8986 width="62">2.95255 | > 11 – 15 years width="41">75 width="58">8.2000 width="62">2.72625 | > More than 15 years width="41">89 width="58">8.0787 width="62">3.47793 | > Compensation width="126">Less than 5 years width="41">88 width="58">4.8864 width="62">1.85343 width="43" rowspan="4">3 align="center"> align="center">397 width="42" rowspan="4">2.115 width="48" rowspan="4">.000 | > 6 - 10 years width="41">148 width="58">4.9122 width="62">1.83292 | > 11 – 15 years width="41">75 width="58">4.9067 width="62">1.53494 | > More than 15 years width="41">89 width="58">5.4607 width="62">2.06737 |
A one way between groups analysis of variance was conducted to explore the impact of age at .000 regarding Job Performance.
Administrative Responsibility
Respondents as Administrative Responsibility according to Workplace Bullying
| width="60" valign="top"> Variable width="36" valign="top">N width="66" valign="top">Mean width="66" valign="top">SD width="54" valign="top">t-value width="35" valign="top">df width="37" valign="top">Sig | > Workplace Bullying width="60" valign="top">Yes width="36" valign="top">219 width="66" valign="top">116.4932 width="66" valign="top">35.88902 width="54" rowspan="2" valign="top">-1.309 width="35" rowspan="2" valign="top">400 width="37" rowspan="2" valign="top">.191 | > No width="36" valign="top">181 width="66" valign="top">121.5801 width="66" valign="top">41.84854 | > Behavior that causes isolation width="60" valign="top">Yes width="36" valign="top">219 width="66" valign="top">33.4018 width="66" valign="top">10.26409 width="54" rowspan="2" valign="top">-1.300 width="35" rowspan="2" valign="top">400 width="37" rowspan="2" valign="top">.194 | > No width="36" valign="top">181 width="66" valign="top">34.8564 width="66" valign="top">12.10837 | > Behavior that undermining professional status width="60" valign="top">Yes width="36" valign="top">219 width="66" valign="top">23.5342 width="66" valign="top">7.70990 width="54" rowspan="2" valign="top">-1.417 width="35" rowspan="2" valign="top">400 width="37" rowspan="2" valign="top">.157 | > No width="36" valign="top">181 width="66" valign="top">24.7348 width="66" valign="top">9.23257 | > Behavior that undermining victim as a person width="60" valign="top">Yes width="36" valign="top">219 width="66" valign="top">48.0776 width="66" valign="top">15.37448 width="54" rowspan="2" valign="top">-1.335 width="35" rowspan="2" valign="top">400 width="37" rowspan="2" valign="top">.183 | > No width="36" valign="top">181 width="66" valign="top">50.2983 width="66" valign="top">17.89287 | > Direct negative behavior width="60" valign="top">Yes width="36" valign="top">219 width="66" valign="top">11.4795 width="66" valign="top">3.04150 width="54" rowspan="2" valign="top">-.680 width="35" rowspan="2" valign="top">400 width="37" rowspan="2" valign="top">.497 | > No width="36" valign="top">181 width="66" valign="top">11.6906 width="66" valign="top">3.15231 |
An independent – samples t-test was conducted to compare administrative responsibility type scores at .191
Table 23.
Respondents as Administrative Responsibility according to Job Satisfaction
| Variable width="68">N width="88">Mean width="96">Std.D width="74">t width="62">df width="17">Sig | > Yes width="68">219 width="88">74.6484 width="96">19.87806 width="74" rowspan="2">-1.083 width="62" rowspan="2">400 width="17" rowspan="2">.279 | > No width="68">181 width="88">76.9171 width="96">21.96610 |
An independent – samples t-test was conducted to compare administrative responsibility type scores at .279 regarding job Satisfaction.
Table 24.
Respondents as Administrative Responsibility according to Job Performance
| width="63"> Variable width="42">N width="66">Mean width="72">SD width="66">t-value width="60">df width="60">Sig | > Job Performance width="63">Yes width="42">219 width="66">32.4612 width="72">10.09051 width="66" rowspan="2">-1.152 width="60" rowspan="2">400 width="60" rowspan="2">.250 | > No width="42">181 width="66">33.6906 width="72">11.22761 | > Work-life conflicts width="63">Yes width="42">219 width="66">9.8676 width="72">2.72700 width="66" rowspan="2">-1.070 width="60" rowspan="2">400 width="60" rowspan="2">.285 | > No width="42">181 width="66">10.1768 width="72">3.04808 | > Leadership width="63">Yes width="42">219 width="66">9.8311 width="72">3.29773 width="66" rowspan="2">-1.046 width="60" rowspan="2">400 width="60" rowspan="2">.296 | > No width="42">181 width="66">10.1989 width="72">3.73187 | > Working conditions width="63">Yes width="42">219 width="66">7.8813 width="72">3.00070 width="66" rowspan="2">-.736 width="60" rowspan="2">400 width="60" rowspan="2">.462 | > No width="42">181 width="66">8.1105 width="72">3.21264 | > Compensation width="63">Yes width="42">219 width="66">4.8813 width="72">1.75692 width="66" rowspan="2">-1.744 width="60" rowspan="2">400 width="60" rowspan="2">.082 | > No width="42">181 width="66">5.2044 width="72">1.94570 |
Table 25 obj 7 (7.15) Respondents as Administrative Responsibility according to Job Performance An independent – samples t-test was conducted to compare administrative responsibility type scores at .250
Class Level you Teach
Respondents as Class Level You Teach according to Workplace Bullying
| width="69"> Variable width="48">N width="66">Mean width="85">SD width="43">df width="41">F width="42">Sig | > Workplace Bullying width="69">8th width="48">151 width="66">121.8477 width="85">38.57421 width="43" rowspan="3">3 align="center"> align="center">397 width="41" rowspan="3">1.596 width="42" rowspan="3">.001 | > 9th width="48">163 width="66">119.2515 width="85">39.70094 | > 10th width="48">86 width="66">112.5698 width="85">36.82695 | > Behavior that causes isolation width="69">8th width="48">151 width="66">34.9272 width="85">11.12121 width="43" rowspan="3">3 align="center"> align="center">397 width="41" rowspan="3">1.556 width="42" rowspan="3">.000 | > 9th width="48">163 width="66">34.1902 width="85">11.42261 | > 10th width="48">86 width="66">32.2907 width="85">10.56728 | > Behavior that undermining professional status width="69">8th width="48">151 width="66">24.7086 width="85">8.41157 width="43" rowspan="3">3 align="center"> align="center">397 width="41" rowspan="3">1.733 width="42" rowspan="3">.000 | > 9th width="48">163 width="66">24.2577 width="85">8.63998 | > 10th width="48">86 width="66">22.6279 width="85">8.03821 | > Behavior that undermining victim as a person width="69">8th width="48">151 width="66">50.5298 width="85">16.44377 width="43" rowspan="3">3 align="center"> align="center">397 width="41" rowspan="3">1.734 width="42" rowspan="3">.000 | > 9th width="48">163 width="66">49.1718 width="85">16.98096 | > 10th width="48">86 width="66">46.3721 width="85">15.87602 | > Direct negative behavior width="69">8th width="48">151 width="66">11.6821 width="85">3.09918 width="43" rowspan="3">3 align="center"> align="center">397 width="41" rowspan="3">.512 width="42" rowspan="3">.001 | > 9th width="48">163 width="66">11.6319 width="85">3.14261 | > 10th width="48">86 width="66">11.2791 width="85">2.98881 |
A one way between groups analysis of variance was conducted to explore the impact of class level at .001 regarding Workplace Bullying.
Respondents as Class Level You Teach according to Job Satisfaction
| Variable width="78" valign="top">N width="89" valign="top">Mean width="94" valign="top">Std.D width="64" valign="top">df width="66" valign="top">F width="60" valign="top">Sig | > 8th width="78" valign="top">151 width="89" valign="top">77.0596 width="94" valign="top">20.80424 width="64" rowspan="3" valign="top">3> >397 width="66" rowspan="3" valign="top">.852 width="60" rowspan="3" valign="top">.001 | > 9th width="78" valign="top">163 width="89" valign="top">75.6012 width="94" valign="top">21.52476 | > 10th width="78" valign="top">86 width="89" valign="top">73.3837 width="94" valign="top">19.63800 |
A one way between groups analysis of variance was conducted to explore the impact of class level at .001 regarding Job satisfaction.
Table 27.
Respondents as Class Level You Teach according to Job Performance
| width="70"> Variable width="54">N width="72">Mean width="78">SD width="54">Df width="54">F width="54">Sig | > Job Performance width="70">8th width="54">151 width="72">33.9669 width="78">10.54477 width="54" rowspan="3">3 align="center"> align="center">397 width="54" rowspan="3">1.402 width="54" rowspan="3">.000 | > 9th width="54">163 width="72">32.8957 width="78">10.93449 | > 10th width="54">86 width="72">31.5814 width="78">10.10121 | > Work-Life Conflicts width="70">8th width="54">151 width="72">10.2185 width="78">2.86797 width="54" rowspan="3">3 align="center"> align="center">397 width="54" rowspan="3">.949 width="54" rowspan="3">.000 | > 9th width="54">163 width="72">9.9816 width="78">2.96580 | > 10th width="54">86 width="72">9.6860 width="78">2.71926 | > Leadership width="70">8th width="54">151 width="72">10.2649 width="78">3.50181 width="54" rowspan="3">3 align="center"> align="center">397 width="54" rowspan="3">1.399 width="54" rowspan="3">.000 | > 9th width="54">163 width="72">10.0245 width="78">3.58142 | > 10th width="54">86 width="72">9.4767 width="78">3.32451 | > Working Conditions width="70">8th width="54">151 width="72">8.1921 width="78">3.11066 width="54" rowspan="3">3 align="center"> align="center">397 width="54" rowspan="3">.947 width="54" rowspan="3">.000 | > 9th width="54">163 width="72">7.9877 width="78">3.18753 | > 10th width="54">86 width="72">7.6163 width="78">2.89083 | > Compensation width="70">8th width="54">151 width="72">5.2914 width="78">1.82058 width="54" rowspan="3">3 align="center"> align="center">397 width="54" rowspan="3">2.571 width="54" rowspan="3">.000 | > 9th width="54">163 width="72">4.9018 width="78">1.85996 | > 10th width="54">86 width="72">4.8023 width="78">1.84595 |
A one way between groups analysis of variance was conducted to explore the impact of class level at .000 regarding Workplace Bullying.
Institute Type
Table Respondents as Institute Type according to Workplace Bullying
| width="61"> Variable width="41">N width="71">Mean width="66">SD width="56">t-value width="46">Df width="40">Sig | > Workplace Bullying width="61">Public width="41">210 width="71">124.8333 width="66">35.88902 width="56" rowspan="2">3.319 width="46" rowspan="2">400 width="40" rowspan="2">.001 | > Private width="41">190 width="71">112.1211 width="66">41.84854 | > Behavior that causes Isolation width="61">Public width="41">210 width="71">35.7143 width="66">10.26409 width="56" rowspan="2">3.156 width="46" rowspan="2">400 width="40" rowspan="2">.002 | > Private width="41">190 width="71">32.2316 width="66">12.10837 | > Behavior that undermining the Professional Status width="61">Public width="41">210 width="71">25.3000 width="66">7.70990 width="56" rowspan="2">3.076 width="46" rowspan="2">400 width="40" rowspan="2">.002 | > Private width="41">190 width="71">22.7263 width="66">9.23257 | > Behavior that undermining the Victim as Person width="61">Public width="41">210 width="71">51.8762 width="66">15.37448 width="56" rowspan="2">3.596 width="46" rowspan="2">400 width="40" rowspan="2">.000 | > Private width="41">190 width="71">45.9947 width="66">17.89287 | > Direct Negative Behavior width="61">Public width="41">210 width="71">11.9429 width="66">3.04150 width="56" rowspan="2">2.520 width="46" rowspan="2">400 width="40" rowspan="2">.012 | > Private width="41">190 width="71">11.1684 width="66">3.15231 |
An independent – samples t-test was conducted to compare Institute type scores at .001 regarding workplace bullying.
Table 29.
Respondents as Institute Type according to Job Satisfaction
| Variable width="61">N width="84">Mean width="91">Std.D width="71">t-value width="61">df width="65">Sig 2 | > Public width="61">210 width="84">78.9857 width="91">20.71531 width="71" rowspan="2">3.382 width="61" rowspan="2">400 width="65" rowspan="2">.001 | > Private width="61">190 width="84">72.0158 width="91">20.44077 |
An independent – samples t-test was conducted to compare Institute type at .001 regarding job Satisfaction.
Table 30.
Respondents as Institute Type according to Job Performance
| width="63" valign="top"> Variable width="53" valign="top">N width="63" valign="top">Mean width="68" valign="top">SD width="58" valign="top">t-value width="53" valign="top">df width="45" valign="top">Sig | > Job Performance width="63">Public width="53">210 width="63">34.9476 width="68">10.73037 width="58" rowspan="2">3.887 width="53" rowspan="2">400 width="45" rowspan="2">.000 | > Private width="53">190 width="63">30.8842 width="68">10.11193 | > Work-Life Conflicts width="63">Public width="53">210 width="63">10.4619 width="68">2.85888 width="58" rowspan="2">3.363 width="53" rowspan="2">400 width="45" rowspan="2">.001 | > Private width="53">190 width="63">9.5053 width="68">2.82046 | > Leadership width="63">Public width="53">210 width="63">10.4667 width="68">3.57039 width="58" rowspan="2">2.842 width="53" rowspan="2">400 width="45" rowspan="2">.005 | > Private width="53">190 width="63">9.4789 width="68">3.35660 | > Working Conditions width="63">Public width="53">210 width="63">8.3429 width="68">3.21726 width="58" rowspan="2">2.445 width="53" rowspan="2">400 width="45" rowspan="2">.004 | > Private width="53">190 width="63">7.5895 width="68">2.91500 | > Compensation width="63">Public width="53">210 width="63">5.6762 width="68">1.84829 width="58" rowspan="2">7.926 width="53" rowspan="2">400 width="45" rowspan="2">.000 | > Private width="53">190 width="63">4.3105 width="68">1.56800 |
An independent – samples t-test was conducted to compare Institute type at level = .000 regarding Job performance.
Discussion
This part discussed the connections between each variable and factors of workplace bullying, job satisfaction and job performance. The literature research has shown that nations were pioneers in this area (Lutgen-Sandvik et al., 2007). Workplace bullying spread all over the world. Four factors were selected to identify the perceived level of teachers among workplace bullying. There were moderate-to-strong relationships between WPB and the categories of work discontent, management dissatisfaction, and supervisor dissatisfaction (Arenas, 2015). When teachers become a victim of workplace bullying their job satisfaction is badly affected. The relationship between workplace bullying and job satisfaction Quine (2001) was found to be positive, suggesting that job satisfaction was able to counteract the negative influence on job satisfaction.
The objective was to investigate the relationship between workplace bullying and job performance. Einarsen et al. (2004) found that bullying has a detrimental influence on work performance, but this influence is difficult to determine. The sixth objective was to examine the relationship between job satisfaction and job performance, which showed that there is a positive correlation between both variables. The researchers also discovered a strong link between work happiness and productivity, which supports previous findings. Both variables are affected by each other. Judge et al. (2001) and Rashed (2001) discovered a substantial link between work happiness and job performance, and our research supports previous findings. Some writers have argued that the association between work happiness and performance is minor, while others have shown that the two factors are strongly linked (Christen et al., 2006). Both variables are affected by each other.
The role of demographic variables with other variables. WPB was substantially correlated with the offenders’ sex, age, educational attainment, class standing, and kind of institution, experience, administrative responsibility, and a number of subordinates. This result is consistent with the literature (Namie, 2009). According to the analysis, there is an impact on gender. Whether it male or female, both are the victims of workplace bullying and dissatisfied by their job which affects job performance. Age has no impact on teachers, while the level of age group. The qualification also doesn’t matter. Teaching experience has an effect because low-experienced teachers become more victim of bullying. Administrative responsibility have no significant relationship. The class level they teach has a significant relation. Institute types have also significant relation with all variables.
Conclusion
This study aimed to identify the perceived level of workplace bullying, job satisfaction and job performance, and examine the role of demographic variables in workplace bullying. A stratified random sampling strategy was used to select four hundred teachers from public and private schools in Lahore. The findings showed that yes, workplace bullying exists in society, and that it has long-lasting effects on the target, witnesses, and organization. The act often has comparable consequences on witnesses as it does on the victim (Blake et al., 2015). This is especially troubling considering how many states report having trouble finding and keeping competent instructors. Bullying victims have a feeling of powerlessness and a lack of control over every part of their life, even beyond the confines of the classroom (Nielsen et al., 2012). This research has assessed the prevalence of workplace bullying among educators, which has a negative impact on job satisfaction and job performance. It has been found that low levels of workplace bullying do better than those who have high levels. Companies have policies that show zero tolerance for bullying at work, with strong punishments for offenders while offering enough assistance for victims of bullying. Bullying has a detrimental effect on employee morale and productivity.
Figure 1
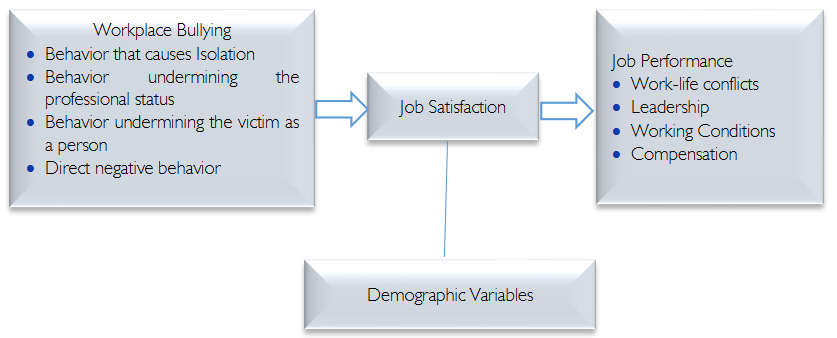
Figure 2
References
- Akar, N. (2013). The Relationships among Perceived Job Stressors, Workplace Bullying and Job Stress in the Health Care Services in Turkey: A Structural Equation Modeling (SEM) Approach. International Journal of Humanities and Social Science, 3(14), 248-257.
- Amy, C., & Francis. (2014). Workplace Bullying and Job Satisfaction: The Moderating Effect of Perceived Organizational Support, 95-104.
- Armstrong, M. (2005). A Handbook of Human Resource Mnagement practices. UK: Kogan.
- Bentley, T. A., Teo, S. T. T., McLeod, L., Tan, F., Bosua, R., & Gloet, M. (2016). The role of organisational support in teleworker wellbeing: A socio-technical systems approach. Applied Ergonomics, 52, 207-215.
- Bernstein, C., & Trimm, L. (2016). The impact of workplace bullying on individual wellbeing: The moderating role of coping. South African Journal of Human Resource Management, 14(1), 1-12.
- Blasé, J., & Blasé, J. (2004a). The dark side of school leadership: implications for administrator preparation. Leadership and Policy in Schools, 3(4), 245-273.
- Blake, J. J., Banks, C. S., Patience, B. A., & Lund, E. M. (2015). School-based mental health professionals bullying assessment practices: A call for evidence-based bullying assessment guidelines. Professional School Counseling, 18(1), 136-147.
- Bostanci, A. B. (2013). The role of positive emotion towards work as a mediator in the relationship between organizational responsiveness towards teachers and isolation in professional life. Educational Research and Reviews, 8(8), 367.
- Christen, M., Iyer, G. & Soberman, D. (2006). Job satisfaction, job performance and effort: A re- examination using agency theory. Journal of Marketing, 70, 137-150.
- Cooper, C. D., & Kurland, N. B. (2002). Telecommuting, professional isolation, and employee development in public and privateorganizations. Journal of Organizational Behavior: The International Journal of Industrial, Occupational and Organizational Psychology and Behavior, 23(4), 511-532.
- Demirtas, Z. (2010). Teachers’ job satisfaction levels. Procedia-Social and Behavioral Sciences, 9, 1069- 1073.
- De Wet, C. (2010). The reasons for and the impact of principal-on-teacher bullying on the victims’ private and professional lives. Teaching and Teacher Education, 26, 1450-1459.
- Einarsen, S. (1999). The nature and causes of bullying at work. International Journal of Manpower, 20(1/2), 16-27.
- Einarsen, S., Hoel, H., & Cooper, C. (Eds.). (2003). Bullying and emotional abuse in the workplace: International perspectives in research and practice. CRC Press.
- Gallatin, K. A. (2018). Teleworker Isolation: Possible Effects of Workplace Relationships and Support (Doctoral dissertation, Baker College (Michigan)).
- Giorgi, G., Leon-Perez, J. M., & Arenas, A. (2015). Are bullying behaviors tolerated in some cultures? Evidence for a curvilinear relationship between workplace bullying and job satisfaction among Italian workers. Journal of Business Ethics, 131(1), 227-237.
- Golden, T. D., Veiga, J. F., & Dino, R. N. (2008), The impact of professional isolation on teleworker job performance and turnover intentions: Does time spent teleworking, interacting face-to-face, or having access to communication-enhancing technology matter?. Journal of Applied Psychology, 93(6), 1412.
- Güleryüz, G., Güney, S., Aydın, E. M., & Aşan, Ö. (2008). The mediating effect of job satisfaction between emotional intelligence and organizational commitment of nurses: A questionnaire survey. International Journal of Nursing Studies, 45(11), 1625-1635.
- Hamel, (2000). Effect Of Work Place Bullying On Job Satisfaction And Organisational Productivity - an empirical study, 478- 484.
- Hoel, H., & Cooper, C. L. (2000). Working with victims of workplace bullying. (In Kemshall, H. & Pritchard, J., ed. Good practice in working with victims of violence. London; Philadelphia: Jessica Kingsley.
- Hogh, A., Mikkelsen, E. G., & Hansen, A. M. (2012). Impact of bullying on workers [Kindle edition]. (In Tehrani, N., ed. Workplace bullying: Symptoms and Solutions. Hove; New York: Routledge.
- Ikanyon, D. N., & Ucho, A. (2013). Workplace bullying, job satisfaction and Job performance among employees in Nigeria. European Journal of Business and Management, 5(23), 116-123.
- Judge, T. A., Thoresen, C. J., Bono, J. E., & Patton, G. K. (2001). The job satisfaction–job performance relationship: A qualitative and quantitative review. Psychological bulletin, 127(3), 376.
- Kemp, V. (2014). Antecedents, consequences and interventions for workplace bullying. Current Opinion in Psychiatry, 27(5), 364-368.
- Lutgen-Sandvik, P., Tracy, S. J., & Alberts, J. K. (2007). Burned by Bullying in the American Workplace: Prevalence, Perception, Degree and Impact. Journal of Management Studies, 44(6), 837-862.
- Locke, E. A. (1976). The nature and causes of job satisfaction. In M. D. Dunette (Ed.), Handbook of Industrial and Organizational Psychology, Illinois: Chicago: RandMcNally.
- Mathisen, G. E., Einarsen, S., & Mykletun, R. (2011). The relationship between supervisor personality, supervisors’ perceived stress and workplace bullying. Journal of Business Ethics, 99(4), 637-651.
- McMahon, L. (2000). Bullying and harassment in the workplace. International Journal of Contemporary Hospitality Management, 12(6), 384-387.
- Meriläinen, M., Sinkkonen, H., Puhakka, H., & Käyhkö, K. (2016). Bullying and inappropriate behavior among faculty personnel. Policy Futures in Education, 14(6), 617-634.
- Motowidlo, S. J., Borman, W. C., & Schmit, M. J. (1997). A theory of individual differences in task and contextual performance. HumanPerformance, 10, 71–83.
- Namie, G. (2009). (Still) Bullying with Impunity Labor Day Survey. Retrieved from
- Nielsen, M. B., Hetland, J., Matthiesen, S. B., & Einarsen, S. (2012). Longitudinal relationships between workplace bullying and psychological distress. Scandinavian Journal of Work, Environment & Health, 38(1), 38 46.
- Oade, A. (2009). Managing Workplace Bullying.
- Oladapo, V., & Banks, L. (2013). Management Bullies: The Effect on Employees. Journal Of Business Studies Quarterly, 4(4), 107-120.
- Ostroff, C. (1992). The relationship between satisfaction, attitudes, and performance: An organizational level analysis. Journal of Applied Psychology, 77(6), 963-974.
- Quine, L. (2001). Workplace Bullying in Nurses. Journal of Health Psychology, 6 (1), 73-84.
- Riggle, R. J., Solomon, P., & Artis, A. (2015). The impact of perceived organizational support on salesperson psychological and behavioral work outcomes. International Journal of Management Research and Business Strategy, 4(1), 134-147.
- Rosenthal, B. (2008). Bullying. Detroit: Greenhaven Press.
- Salin, D. (2003). Ways of explaining workplace bullying: a review of enabling, motivating and precipitating structures and processes in the work environment. Human Relations, 56(10), 1213-1232.
- Saunders, P., Huynh, A., & Goodman-Delahunty, J. (2007). Defining workplace bullying behavior professional lay definitions of workplace bullying. International Journal of Law and Psychiatry, 30(4- 5), 340-354.
- Snipes, R. L., Oswald, S. L., LaTour, M., & Armenakis, A. A. (2005). The effects of specific job satisfaction facets on customer perceptions of service quality: An employee level analysis. Journal of Business Research, 58(10), 1330- 1339.
- essema, M., & Soeters, J. (2006). Challenges and prospects of HRM in developing countries: testing the HRM-performance link in Eritrean civil service. International Journal of Human Resource Management, 17(1), 86-105.
- Townend, A. (2016). Understanding and addressing bullying in the workplace. Industrial and Commercial Training, 40(5), 270-273.
Cite this article
-
APA : Jabeen, S., Gul, F., & Bashir, I. (2023). Effect of Workplace Bullying on Job Satisfaction and Job Performance at School Level. Global Sociological Review, VIII(I), 21-39. https://doi.org/10.31703/gsr.2023(VIII-I).03
-
CHICAGO : Jabeen, Sadaf, Fariha Gul, and Irfan Bashir. 2023. "Effect of Workplace Bullying on Job Satisfaction and Job Performance at School Level." Global Sociological Review, VIII (I): 21-39 doi: 10.31703/gsr.2023(VIII-I).03
-
HARVARD : JABEEN, S., GUL, F. & BASHIR, I. 2023. Effect of Workplace Bullying on Job Satisfaction and Job Performance at School Level. Global Sociological Review, VIII, 21-39.
-
MHRA : Jabeen, Sadaf, Fariha Gul, and Irfan Bashir. 2023. "Effect of Workplace Bullying on Job Satisfaction and Job Performance at School Level." Global Sociological Review, VIII: 21-39
-
MLA : Jabeen, Sadaf, Fariha Gul, and Irfan Bashir. "Effect of Workplace Bullying on Job Satisfaction and Job Performance at School Level." Global Sociological Review, VIII.I (2023): 21-39 Print.
-
OXFORD : Jabeen, Sadaf, Gul, Fariha, and Bashir, Irfan (2023), "Effect of Workplace Bullying on Job Satisfaction and Job Performance at School Level", Global Sociological Review, VIII (I), 21-39
-
TURABIAN : Jabeen, Sadaf, Fariha Gul, and Irfan Bashir. "Effect of Workplace Bullying on Job Satisfaction and Job Performance at School Level." Global Sociological Review VIII, no. I (2023): 21-39. https://doi.org/10.31703/gsr.2023(VIII-I).03